

La page Statistiques montre ce que chaque commercial a fait sur la période choisie. Un manager y voit son équipe, un commercial ses propres chiffres. Les noms, emails et numéros visibles sur les captures sont fictifs.
Step 1: filter
Select a member or the whole team (1), a list if needed, then the period (2). The Export to CSV button (3) downloads the table.
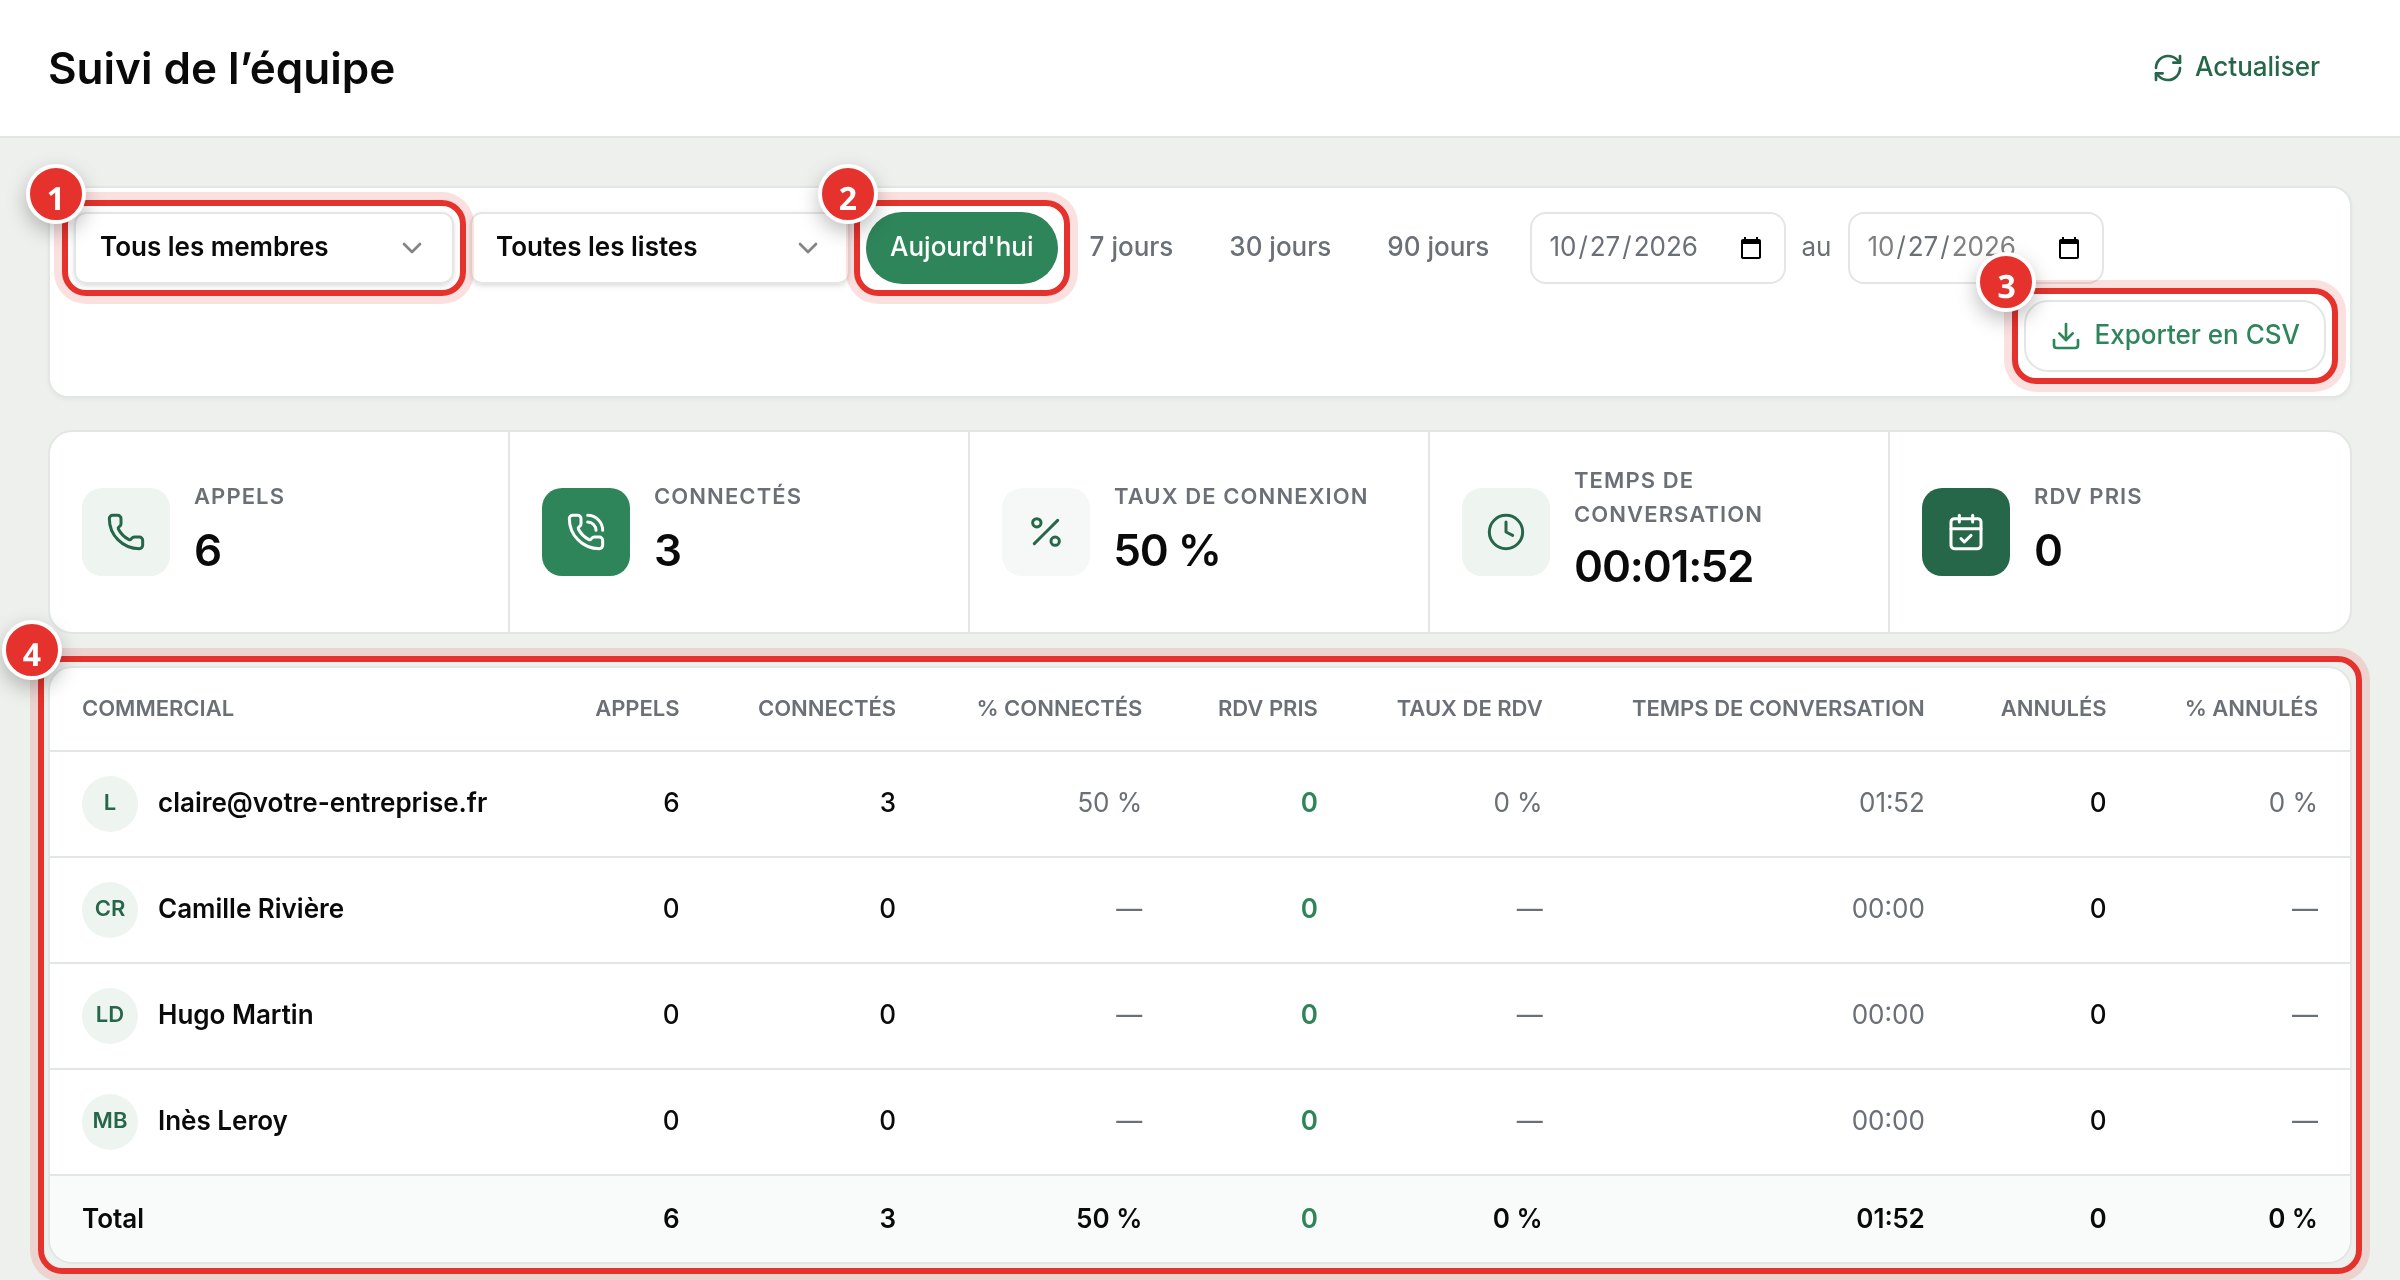
Step 2: read the table
| Column | What it counts |
|---|---|
| Calls | All calls initiated during the period. |
| Connected | Calls where someone answered. |
| Meeting booked | Calls marked as Appointment Booked. |
| Appt Rate | Appointments booked relative to connected calls. |
| Talk time | The cumulative duration of conversations. |
Below the table, the Calls per day chart shows the period's activity. Figures come strictly from actual calls: any status corrected in History is reflected here.